
Electrical Distribution Supply Chain Update
OCTOBER 2022 MARKET WATCH
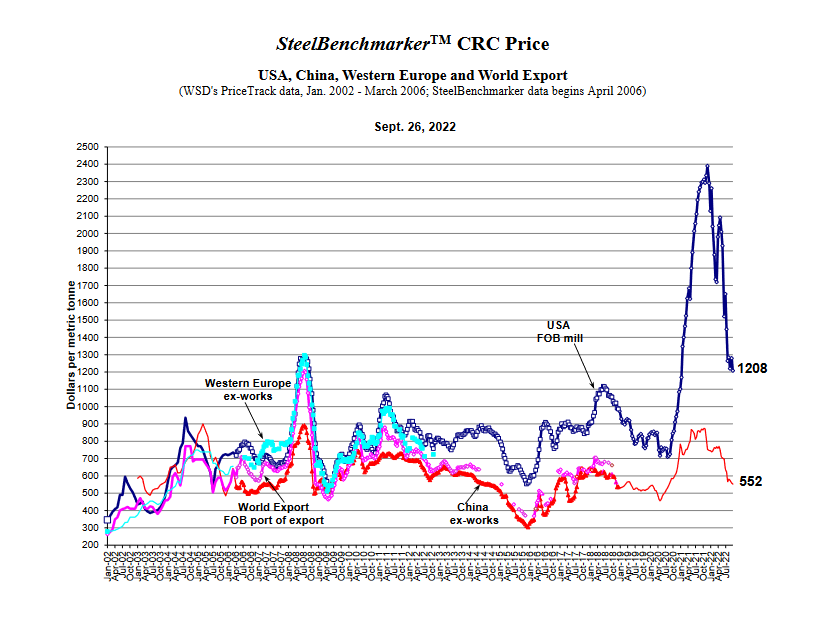
Metals: Copper started September at $3.40 per pound, pretty much the same as it closed the month prior. There was a quick dip, once the Feds raised interest rates once more, but that proved to be short lived. CU has been in and around the $3.50 mark, since the end of June. The price of copper seems fairly stable right now.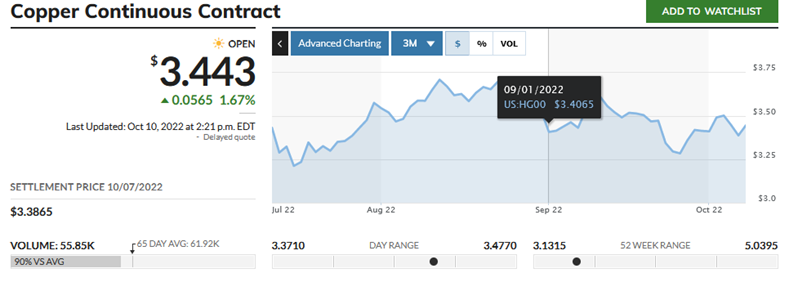 Cold Rolled Steel continues to soften with decreased demand, and certainly more supply. A ton ended September at $1208. Half of the value it was trading at the end of 2021. But still nearly double where it was during the COVID shutdowns of 2020.
 Both Aluminum and Die Cast have been in decline for the past 6 months as well. So, when will you see a softening in price for finished goods? You already have when it comes to steel conduit and building wire. But most other things are still holding a cost higher than the price of their metals as labor costs, shipping and inflation are still contributing factors.
Supply Issues:
There are still some major supply shortages that never got any better over the past 2 years. One of the largest issues in our industry continues to be Gear. Lead times of a year or longer are still common across all major manufacturers. Most notably custom work, such as switchboards, but also metering, which keeps having lead times pushed further and further out.
Most of the Industry is still under allocations when it comes to the aforementioned goods. While we would love to buy hundreds of load centers and breakers to stay in front of supply challenges, we are simply not allowed to buy more than our prior allowance. While some things have become easier to get, there are still many SKUs that nearly everyone is struggling to obtain.
A Look ahead:
Typically the winter months allow many manufacturers to catch up on their backlog, as demand tends to be less while most of the country is heading towards colder weather. More and more workers are rejoining the workforce, which means more product can me made/packed/transported. But there is still a long road ahead before we get back to “normal”.
Both Aluminum and Die Cast have been in decline for the past 6 months as well. So, when will you see a softening in price for finished goods? You already have when it comes to steel conduit and building wire. But most other things are still holding a cost higher than the price of their metals as labor costs, shipping and inflation are still contributing factors.
Supply Issues:
There are still some major supply shortages that never got any better over the past 2 years. One of the largest issues in our industry continues to be Gear. Lead times of a year or longer are still common across all major manufacturers. Most notably custom work, such as switchboards, but also metering, which keeps having lead times pushed further and further out.
Most of the Industry is still under allocations when it comes to the aforementioned goods. While we would love to buy hundreds of load centers and breakers to stay in front of supply challenges, we are simply not allowed to buy more than our prior allowance. While some things have become easier to get, there are still many SKUs that nearly everyone is struggling to obtain.
A Look ahead:
Typically the winter months allow many manufacturers to catch up on their backlog, as demand tends to be less while most of the country is heading towards colder weather. More and more workers are rejoining the workforce, which means more product can me made/packed/transported. But there is still a long road ahead before we get back to “normal”.
SEPTEMBER 2022 SUPPLY CHAIN UPDATE
Nearly all metals are down right now. Even with projected shortages in base metals going forward. Less than a week ago, at the Central Banking Conference, Jerome Powell (U.S. central bank chief) spoke about a painful period of slow economic growth. Powell said the Fed will raise rates as high as needed to restrict growth and would keep them there “for some time” to bring down inflation. The U.S. Federal Reserve is expected to raise interest rates by 75 basis points for a third consecutive policy meeting in September. With the US trying to slow down inflation, it will also slow down growth. And that is affecting our construction metals.AUGUST 2022 SUPPLY CHAIN UPDATE
Copper continues to rebound after plunging below $3.15 per pound nearly a month ago. It is currently trading at almost $3.60, which is still well below the recent high of $4.55 we saw back in June. The last time CU traded at $3.60 per # was in January 2021, so it has been awhile. Even with the Comex being down, the price of finished copper has not gone back to January 2021 levels. The cost of other materials used in making building wire, plus the higher costs of freight and labor, are keeping the price of finished goods much higher than they once were.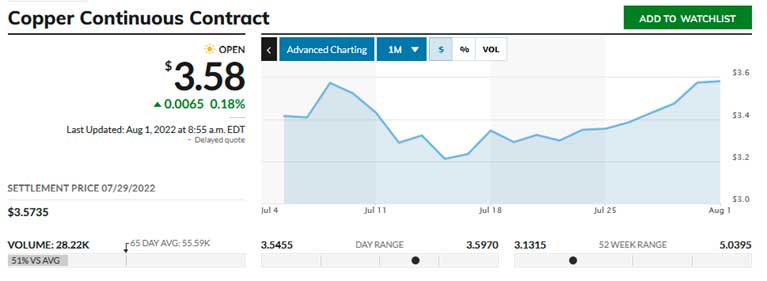 Steel has not fallen as fast as copper, but it is currently down as well, bringing some relief to higher priced conduit. But just like finished cable above, the cost of steel boxes, fittings, rings, etc. have not fallen as of yet. This is due to the same issues, mostly labor and transit costs, both of which remain high.
Prolonged lead times and general allocations are still the biggest issues most projects face. It seems everyone involved in switchgear has issues shipping. And lead times of over a year are suddenly common on certain items. Distributors are still under strict allocations for certain products like most residential breakers and load centers. We simply are not allowed to buy as much as we would like.
Steel has not fallen as fast as copper, but it is currently down as well, bringing some relief to higher priced conduit. But just like finished cable above, the cost of steel boxes, fittings, rings, etc. have not fallen as of yet. This is due to the same issues, mostly labor and transit costs, both of which remain high.
Prolonged lead times and general allocations are still the biggest issues most projects face. It seems everyone involved in switchgear has issues shipping. And lead times of over a year are suddenly common on certain items. Distributors are still under strict allocations for certain products like most residential breakers and load centers. We simply are not allowed to buy as much as we would like.
July 2022 SUPPLY CHAIN UPDATE
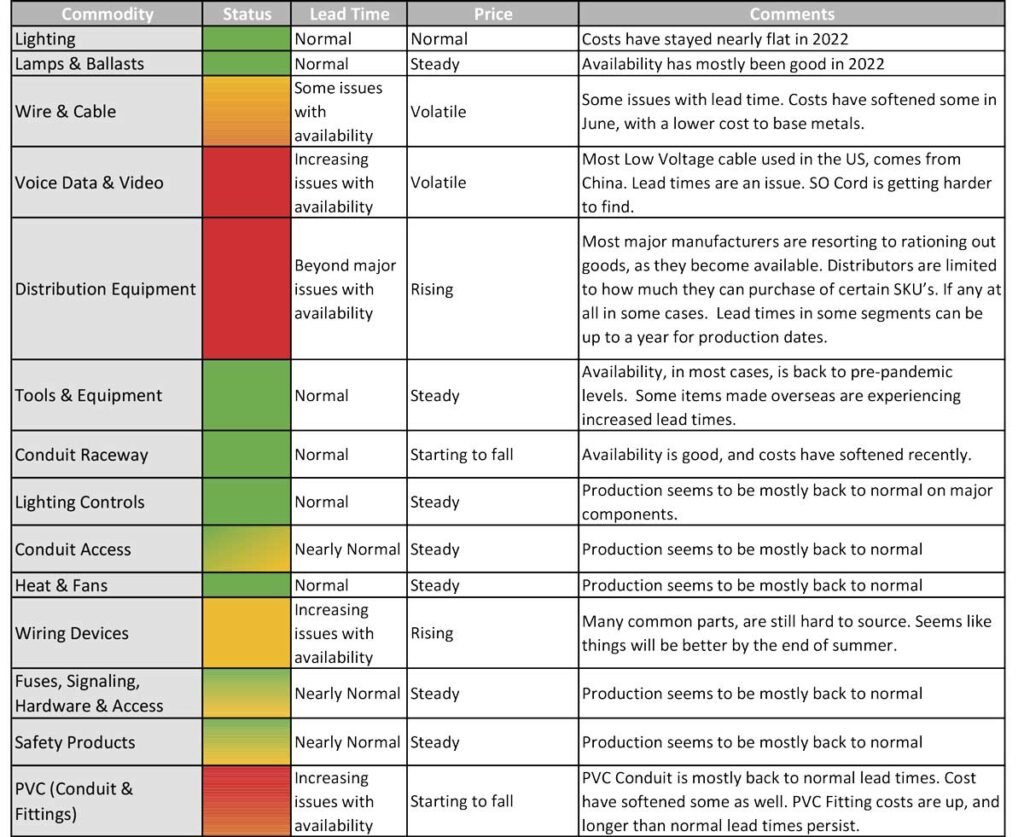
Jump to Chart The highest rate of cost inflation was roughly from Fall of 2020 through Summer 2021. Some segments, such as PVC pipe, more than quadrupled in cost. Steel pipe and copper building wire nearly doubled during that time, as had gear and common core goods, such as boxes and rings. For the past month, costs have stabilized due to many factors. Most notably the supply chain is finally catching up, and many countries are raising interest rates to slow inflation. This in turn has led to a somewhat softening of many base metals, such as steel and copper. In fact, for June 2022, steel conduit was down roughly 10% and building wire was down 12% compared to May. Looking at recent changes to cost… From last June until now (a 1 year study) these common core groups have increased by (rough average):- Steel Conduit up 35%
- Copper Building Wire up 10%
- Low Voltage Cable up 40%
- PVC Conduit up 50%
- PVC Fittings up 50%
- Common core finished steel (Boxes, plaster rings, steel fittings ETC) up 80%
- Lighting up 12%
- Wiring Devices up 10%
- Gear up 45%
- Steel Conduit down 15%. Cost has slowly dropped every month since hitting its all-time high early in January 2022.
- Copper Building Wire up 10%. Cost has come down in the past few weeks, with Copper trading down nearly 20%. But not enough to make up for the past 6 months of high priced finished cable.
- Low Voltage Cable up 40%. Nearly all LV sold in the US is imported. Higher freight costs have kept costs high. Even the lower cost of cable has not brought down the values of LV lately.
- PVC Conduit down 5%. Early January was the all-time high.
- PVC Fittings up 10%. Pipe has come down in value quicker than formed and finished fittings. PVC fittings often still hold a prolonged lead time of several months, which feeds into its still high cost.
- Common core finished steel (boxes, plaster rings, steel fittings, etc.) up 15%. Many segments are still in short supply, which has led to strong costs for steel goods, even with steel conduit slipping some.
- Lighting no noticeable change.
- Wiring Devices up 15%. Product availability has to be feeding into the higher cost of devices. Lead times are still longer on many in demand items.
- Gear up 10%. This average is based on stock and flow goods. Gear is still being allocated by all major US companies.
June 2022 SUPPLY CHAIN UPDATE
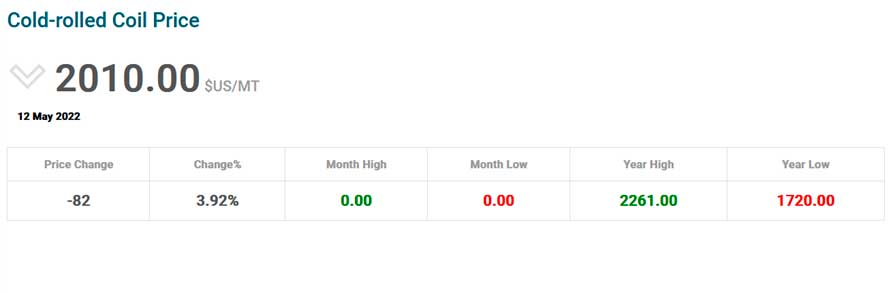
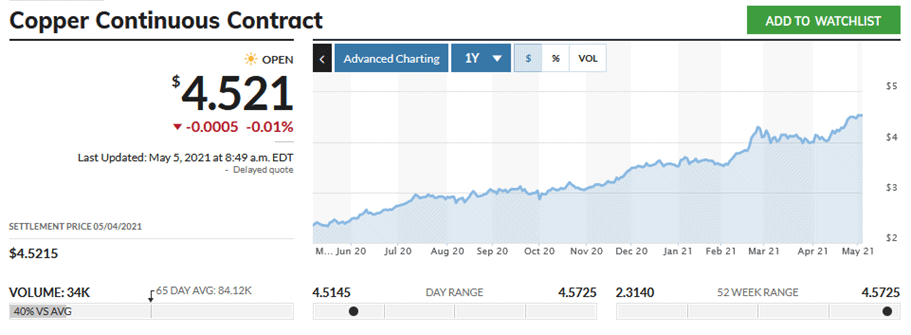
The rising costs of metals once more, coupled with the higher costs of transportation and general supply chain shortages, are pushing costs even higher than we have ever seen before. Metals have been surging once more. Copper went from a low of $4.10 just over 2 weeks ago, to trading at $4.50 as of this writing.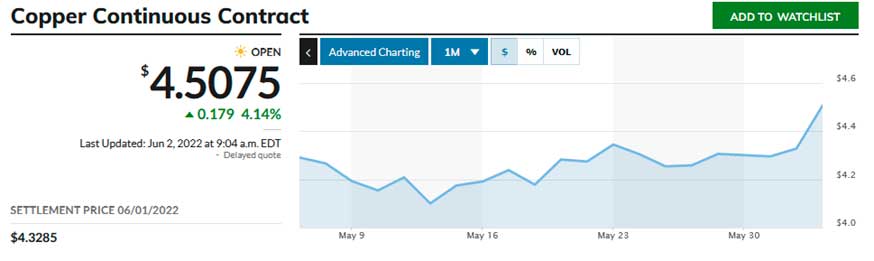 The Steel reports are a bit trickier, as those only come out every couple of weeks. But it looks like Cold Rolled Steel (what our industry uses the most) is going for $2010 PMT now. That is up from the years low of $1720 but still off from the year’s high of $2261.
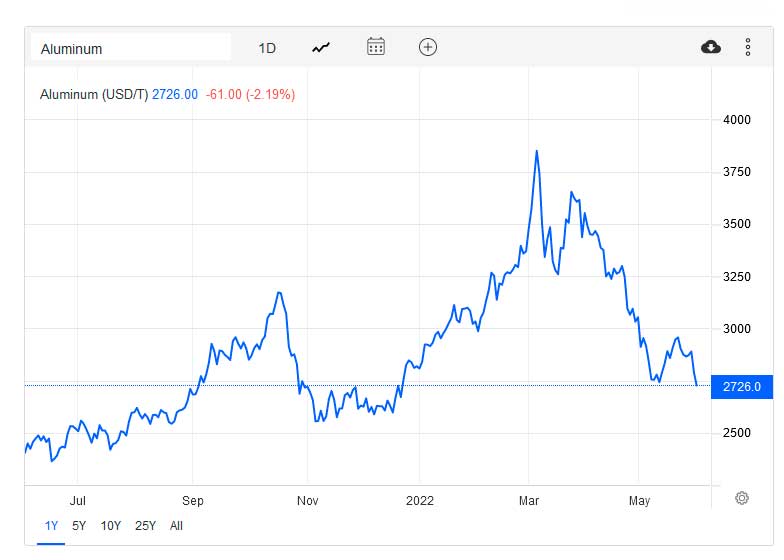
 Aluminum pricing seems to still be soft. It is at $2726 PMT right now, the same as it was in late Dec 21. It had reached a high of $3849 in early March, as most all metals did with the invasion of the Ukraine. But has since settled and has yet to see the resurgence of CU & Steel. Still, with most of the worlds Aluminum coming from China, India & Russia, I would have to think that is the next ferrous metal to start jumping again. As there are certainly supply issues leaving that region.
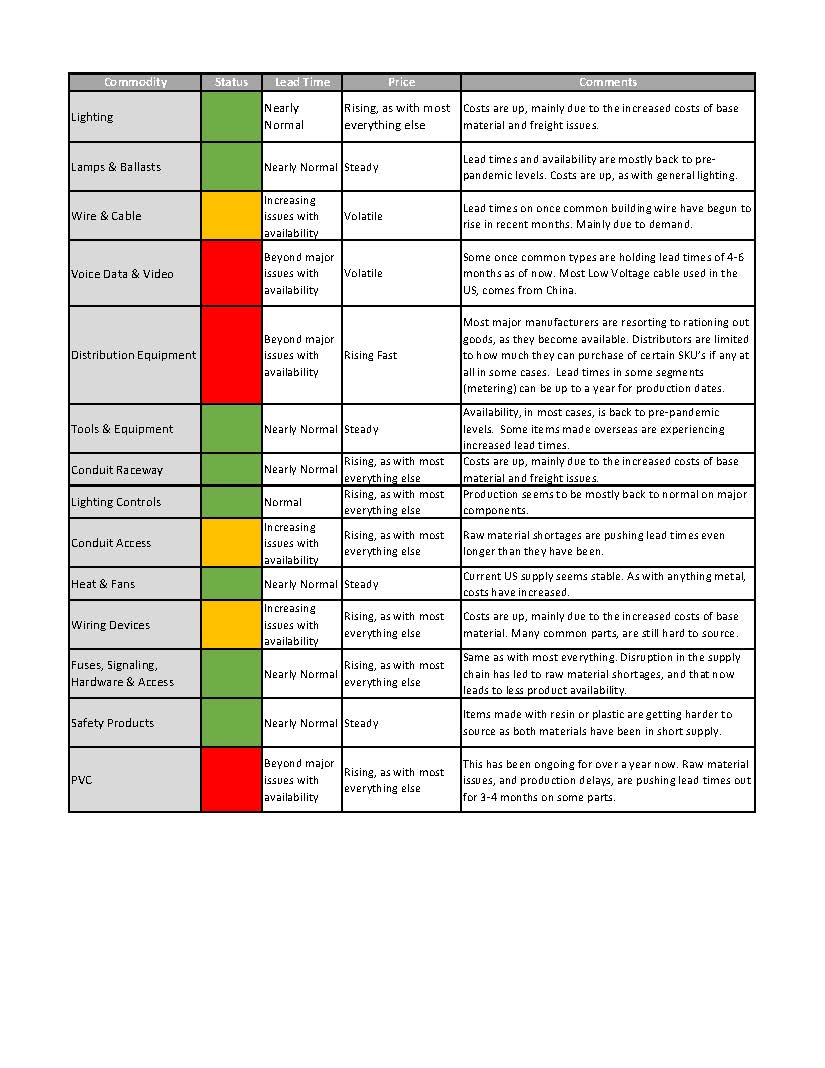
 Across the board, there are no significant changes to the May Commodities Chart below.
May 2022 SUPPLY CHAIN UPDATE
Copper had held steady for most of April. In fact, last month Goldman (one of the largest investment banks) was expecting a new record high for copper costs by June. Warehouses were near empty globally and it was looking like a surging demand would force metals up even higher. Most all reports indicated there would be nearly a 2 year shortfall of copper before stock caught up to demand. Then, by the last week of April, China reported the amount of new COVID cases in their country. First it was the surge in Shanghai, followed by one in Beijing, and they are still bracing for more across the country. Being the world’s largest consumer of copper, and now facing factory shutdowns once more, copper costs started to soften due to their grim outlook. Beyond factories there that actually form and finish metal goods, China’s zero tolerance approach to COVID 19 has seen their banks slash their growth forecasts as lockdowns weigh on their economic activity. That is to say, there won’t be a lot of building going on in China for the foreseeable future, which will limit their consumption of metals even more. This did bring down the cost of raw copper, which had held steady in and around $4.75 per pound for weeks. It seems to have settled around $4.40 for now, but volatile fluctuations are still likely. At it’s current price it is a relatively small drop, but still a drop nonetheless, which we have not seen many of in 2022.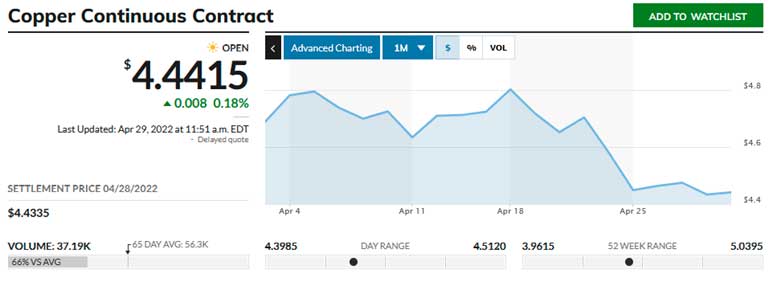 The biggest issues our industry is currently facing, are tied directly to supply and demand. Demand is up, and construction season has begun. But there are still some major shortages for many key products upon which our segment depends. Most notably, once common goods such as decorator devices and simple GFCIs are still hard to source. Any PVC that is not currently in stock, can take months to get. And low voltage cable, which is almost exclusively made in China, is a very hard segment to source currently. Lead times can run 6-9 months in some cases, and that was prior to the COVID surge in China.
Getting many foreign goods to our ports is still a struggle. The war in Europe and the renewed Coronavirus issues in Asia are only making matters worse. Unloading material that does make it to our ports, and then actually getting goods from there to their final destinations is equally challenging. As our transportation troubles continue in the US, the supply chain continues to suffer.
The biggest issues our industry is currently facing, are tied directly to supply and demand. Demand is up, and construction season has begun. But there are still some major shortages for many key products upon which our segment depends. Most notably, once common goods such as decorator devices and simple GFCIs are still hard to source. Any PVC that is not currently in stock, can take months to get. And low voltage cable, which is almost exclusively made in China, is a very hard segment to source currently. Lead times can run 6-9 months in some cases, and that was prior to the COVID surge in China.
Getting many foreign goods to our ports is still a struggle. The war in Europe and the renewed Coronavirus issues in Asia are only making matters worse. Unloading material that does make it to our ports, and then actually getting goods from there to their final destinations is equally challenging. As our transportation troubles continue in the US, the supply chain continues to suffer.
APRIL 2022 SUPPLY CHAIN UPDATE
Copper remains strong, and has been sitting at or near $4.80 per pound for weeks now. To put that in to perspective, Copper was roughly just $4.00 per pound to start April 2021. Metals, in general, remain strong. The London Metal Exchange (LME) imposed sanctions on metals from Russia at the start of the Ukraine war, to the tune of 35% in additional duties. As of this past weekend, April 1st, the LME has actually banned many metals from Russia from even being placed in their approved warehouses. Just one of many reasons why the cost of metals continues to climb. With increased demand for metals, coupled with increased freight costs (up 11% in 2022) and fuel costs (up 37% since the Russian invasion and the sanctions that followed), the US Mills are not only charging more for finished metal, but the costs to move those goods around have gone up as well. And with that, the cost of finished goods continue to climb.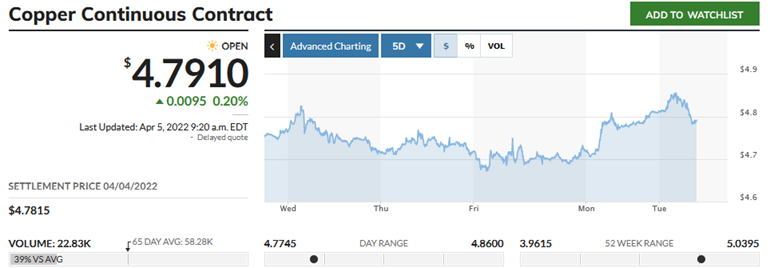 The increased shipping costs are having an impact on most all goods. Some companies are even removing their freight allowed targets, meaning anyone who buys from them will be responsible for freight costs, no matter how much they spend. This is just adding to the increased costs of goods many consumers are seeing.
According to Federal Reserve Chair Jerome Powell, the supply-chain issues “have been larger and longer lasting than anticipated”; adding the pressures have played a “major role” in keeping inflation at four-decade highs.
Product allocations continue, which means many supply houses are still limited to just how much of a certain product they can buy at times. And with increased demand, and forced limited supply, this too is impacting costs and leading to many frustrations with clients who simply cannot buy all the product they need for their projects.
Beyond the reality that things cost more today, the ongoing global supply chain issues also persist. And according to Business Insider, and many other outlets, there’s little sign the supply chain mess is improving. Couple that with the war in Europe, and the surging cases of COVID in China (leading to yet another lockdown) and it appears that there is no end in sight right now to these lingering issues.
The increased shipping costs are having an impact on most all goods. Some companies are even removing their freight allowed targets, meaning anyone who buys from them will be responsible for freight costs, no matter how much they spend. This is just adding to the increased costs of goods many consumers are seeing.
According to Federal Reserve Chair Jerome Powell, the supply-chain issues “have been larger and longer lasting than anticipated”; adding the pressures have played a “major role” in keeping inflation at four-decade highs.
Product allocations continue, which means many supply houses are still limited to just how much of a certain product they can buy at times. And with increased demand, and forced limited supply, this too is impacting costs and leading to many frustrations with clients who simply cannot buy all the product they need for their projects.
Beyond the reality that things cost more today, the ongoing global supply chain issues also persist. And according to Business Insider, and many other outlets, there’s little sign the supply chain mess is improving. Couple that with the war in Europe, and the surging cases of COVID in China (leading to yet another lockdown) and it appears that there is no end in sight right now to these lingering issues.
MARCH 2022 SUPPLY CHAIN UPDATE
With strict new sanctions on Russia, some important facts that will affect our industry directly are outlined below. Combined, Russia and Ukraine lead the global production of metals such as nickel, copper, and iron. Neither country will be able to keep capacity if they are mired in war. With metals making up a large part of our industry, price increases are nearly assured at some point. The longer the war drags on, the higher the cost of metals will likely climb. Russia is the 5th largest steel producing country in the world, with 71.5MIL tons. They rank just behind the US, at 81.6MIL tons. Russia is also the 3rd largest exporter of steel on the planet. While most of our US-made steel is used domestically, we also import more from Russia. In fact, Russia is the 3rd largest country the US imports steel from.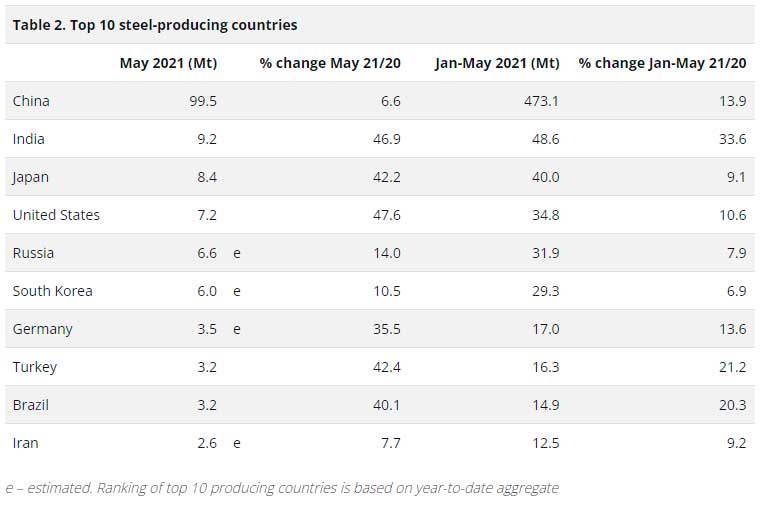 Turkey (NATO) accounted for the largest share of Russia’s steel exports with 15 percent (5 mmt), followed by Taiwan at 11 percent (3.5 mmt), Mexico at 8 percent (2.8 mmt), and Belgium (NATO) at 7 percent (2.3 mmt). The United States (NATO) ranked eighth as a destination for Russian steel, receiving 4 percent of exports (1.2 mmt).
With a united front on sanctions, the NATO members of Turkey, Belgium, the US and Poland account for nearly a third of all Russian steel exports. These countries might have to look elsewhere for foreign steel, and that very likely will push up costs. If the past 5 years have taught us anything, it is that when foreign commodities markets go up, the US producing plants raise costs to match.
Since the United States and its allies have never before attempted to cut a $1.5 trillion economy out of global commerce, there is no way to say for sure how much this will impact costs on the products we sell. It’s possible Russia will just ship what they have to China and let their buddies in Beijing dole it out into the global marketplace. But that is just a guess.
Iron concentrate makes up 98% to 99% of steel and Ukraine is the world’s third largest exporter of iron ore. Now that Ukraine is engaged in war, production of steel will obviously be impacted. With the 2nd largest iron ore reserve in the world (30 billion tons), only China has a larger reserve from which to draw to help make up for lost production.
Just as Pandemic pricing was starting to settle down, this war might force the cost of goods back up. Especially if our NATO allies have to seek commodities from places that we were currently sourcing from. There just wouldn’t be enough to go around and maintain current pricing.
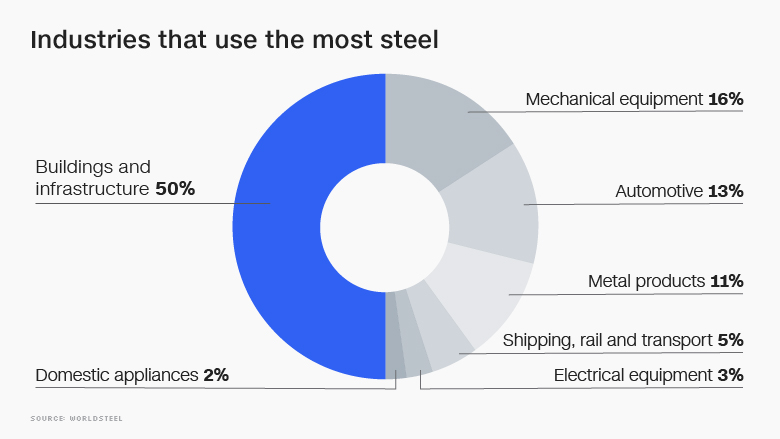
Our industry is overly reliant on steel. Pretty much anything made of metal is at risk of a price hike. Conduit, Flex, Fittings, Boxes, Rings & Gear will be hit the hardest. Gear is a big one as we saw huge delays and price increases of up to 40% during the pandemic.
Turkey (NATO) accounted for the largest share of Russia’s steel exports with 15 percent (5 mmt), followed by Taiwan at 11 percent (3.5 mmt), Mexico at 8 percent (2.8 mmt), and Belgium (NATO) at 7 percent (2.3 mmt). The United States (NATO) ranked eighth as a destination for Russian steel, receiving 4 percent of exports (1.2 mmt).
With a united front on sanctions, the NATO members of Turkey, Belgium, the US and Poland account for nearly a third of all Russian steel exports. These countries might have to look elsewhere for foreign steel, and that very likely will push up costs. If the past 5 years have taught us anything, it is that when foreign commodities markets go up, the US producing plants raise costs to match.
Since the United States and its allies have never before attempted to cut a $1.5 trillion economy out of global commerce, there is no way to say for sure how much this will impact costs on the products we sell. It’s possible Russia will just ship what they have to China and let their buddies in Beijing dole it out into the global marketplace. But that is just a guess.
Iron concentrate makes up 98% to 99% of steel and Ukraine is the world’s third largest exporter of iron ore. Now that Ukraine is engaged in war, production of steel will obviously be impacted. With the 2nd largest iron ore reserve in the world (30 billion tons), only China has a larger reserve from which to draw to help make up for lost production.
Just as Pandemic pricing was starting to settle down, this war might force the cost of goods back up. Especially if our NATO allies have to seek commodities from places that we were currently sourcing from. There just wouldn’t be enough to go around and maintain current pricing.
Our industry is overly reliant on steel. Pretty much anything made of metal is at risk of a price hike. Conduit, Flex, Fittings, Boxes, Rings & Gear will be hit the hardest. Gear is a big one as we saw huge delays and price increases of up to 40% during the pandemic.
 Even though the Comex (which is a set standard rate for a pound of copper) has not moved in weeks, with the war in Ukraine actually happening now, we are starting to see some inorganic price increases of nearly 10%. Could it be profiteering? Looks like it. And once one major manufacturer announced increases Friday (2/25) afternoon, others quickly followed suit, pushing finished copper pricing up immediately. For all the reasons mentioned above, we are very confident steel pricing is bound to go up soon as well.
The Russian stock market lost a third of its value. Over $200BIL (US) in value since the sanctions hit. This will have wide reaching implications on a lot more than just metals. The sanctions will take time to have a real impact. But if the supply chain struggles and pandemic panic buying experiences have taught us anything, it’s that it is better to buy a little extra now than assume it will continue to be easy to get the supplies you need at the prices you like for your summertime projects.
Even though the Comex (which is a set standard rate for a pound of copper) has not moved in weeks, with the war in Ukraine actually happening now, we are starting to see some inorganic price increases of nearly 10%. Could it be profiteering? Looks like it. And once one major manufacturer announced increases Friday (2/25) afternoon, others quickly followed suit, pushing finished copper pricing up immediately. For all the reasons mentioned above, we are very confident steel pricing is bound to go up soon as well.
The Russian stock market lost a third of its value. Over $200BIL (US) in value since the sanctions hit. This will have wide reaching implications on a lot more than just metals. The sanctions will take time to have a real impact. But if the supply chain struggles and pandemic panic buying experiences have taught us anything, it’s that it is better to buy a little extra now than assume it will continue to be easy to get the supplies you need at the prices you like for your summertime projects.
DECEMBER 2021 SUPPLY CHAIN UPDATE
Copper has slipped some, but it is only off a dime from last month’s trading, which equates to a very slight drop in some finished copper cable costs. These ebbs and flows are expected yearend. But copper remains very strong, as this time last year it was trading under $3.50 per pound, and it could be had around $2.50 per pound in winter 2019.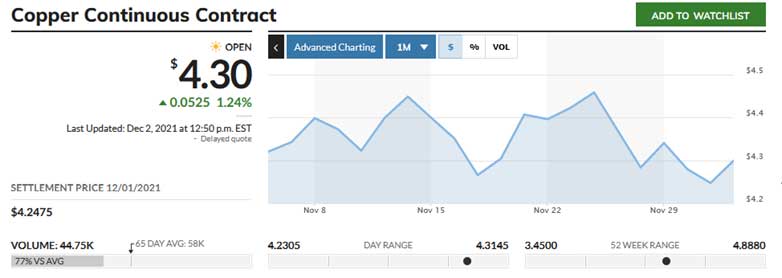 Our industry’s most common steel continues to climb. As you can see by the below, it has more than doubled in the past year. This has lead to record highs for most all products that use US made steel, whereas the cost of a bundle of pipe, has doubled since last summer.
 Most all trade metals continue to be strong. Even plastics, like PVC, are still hard to get for some parts. Lead times on items not in stock are trending at 2-3 months.
The biggest news in our supply chain issues continues to be transportation. More and more products make it to US ports every day. But it has been slow going getting material from the docks to their actual destinations. This backlog doesn’t have an easy fix, and many suggest these issues will stretch well into 2022.
Chicago recently made national news as a chokepoint for rail cars. Some railroads have restricted container shipments into the key Midwestern freight hub as bottlenecks from a flood of container imports stretch inland from the West Coast.
And the ports out West have made global headlines, with many news specials covering the influx of containers. The problem here isn’t getting goods to the US, it is how slowly we are handling them once they hit our shores.
Most all trade metals continue to be strong. Even plastics, like PVC, are still hard to get for some parts. Lead times on items not in stock are trending at 2-3 months.
The biggest news in our supply chain issues continues to be transportation. More and more products make it to US ports every day. But it has been slow going getting material from the docks to their actual destinations. This backlog doesn’t have an easy fix, and many suggest these issues will stretch well into 2022.
Chicago recently made national news as a chokepoint for rail cars. Some railroads have restricted container shipments into the key Midwestern freight hub as bottlenecks from a flood of container imports stretch inland from the West Coast.
And the ports out West have made global headlines, with many news specials covering the influx of containers. The problem here isn’t getting goods to the US, it is how slowly we are handling them once they hit our shores.
NOVEMBER 2021 SUPPLY CHAIN UPDATE
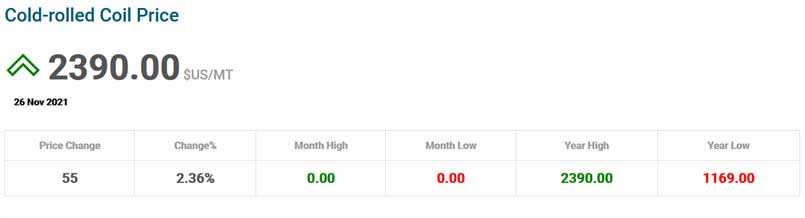
Copper, while slightly volatile in October, seems to have settled around $4.40 lately. Which represents a very strong market, as looming copper shortages continue to make headlines.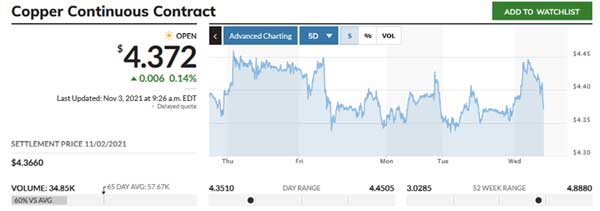 Steel continues to stay strong as well. Looking at Cold Rolled Steel, October did close $19 off this year’s high mark, which was the highest CRC has ever sold for in the US. It is still nearly double the price we saw at the beginning of the year.
US mills seem to be keeping pace with production for now, but in some cases, steel finished goods brought in from abroad are still taking quite awhile before they make their way to Distributors’ shelves. This has more to do with shipping issues, than anything else.
Steel continues to stay strong as well. Looking at Cold Rolled Steel, October did close $19 off this year’s high mark, which was the highest CRC has ever sold for in the US. It is still nearly double the price we saw at the beginning of the year.
US mills seem to be keeping pace with production for now, but in some cases, steel finished goods brought in from abroad are still taking quite awhile before they make their way to Distributors’ shelves. This has more to do with shipping issues, than anything else.
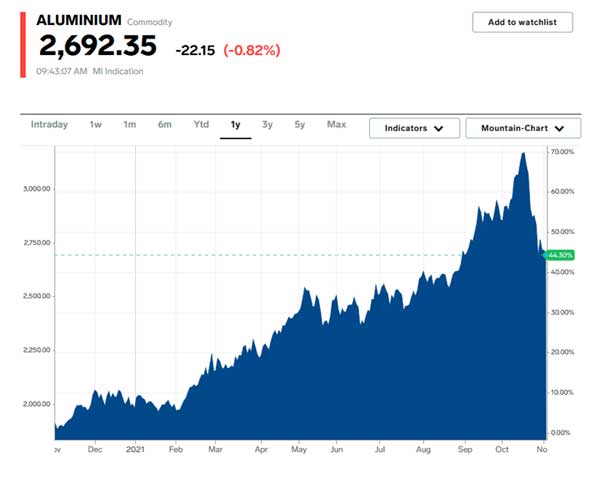
 While steel and copper have been fairly steady, they are still priced near their peaks, both of which were record highs. The same can now be said for Aluminum (AU) as well. With demand for “Green” goods at an all time high, Aluminum is expected to have the same shortage concerns as copper, which also is being used in the same segment.
Aluminum is currently priced over 80% higher than its May 2020 low; trading at its highest cost in the past decade. A lot of AU supply is sitting in Asia, and with ongoing shipping issues, both the US and EU are facing supply shortages.
While steel and copper have been fairly steady, they are still priced near their peaks, both of which were record highs. The same can now be said for Aluminum (AU) as well. With demand for “Green” goods at an all time high, Aluminum is expected to have the same shortage concerns as copper, which also is being used in the same segment.
Aluminum is currently priced over 80% higher than its May 2020 low; trading at its highest cost in the past decade. A lot of AU supply is sitting in Asia, and with ongoing shipping issues, both the US and EU are facing supply shortages.
 ————
————
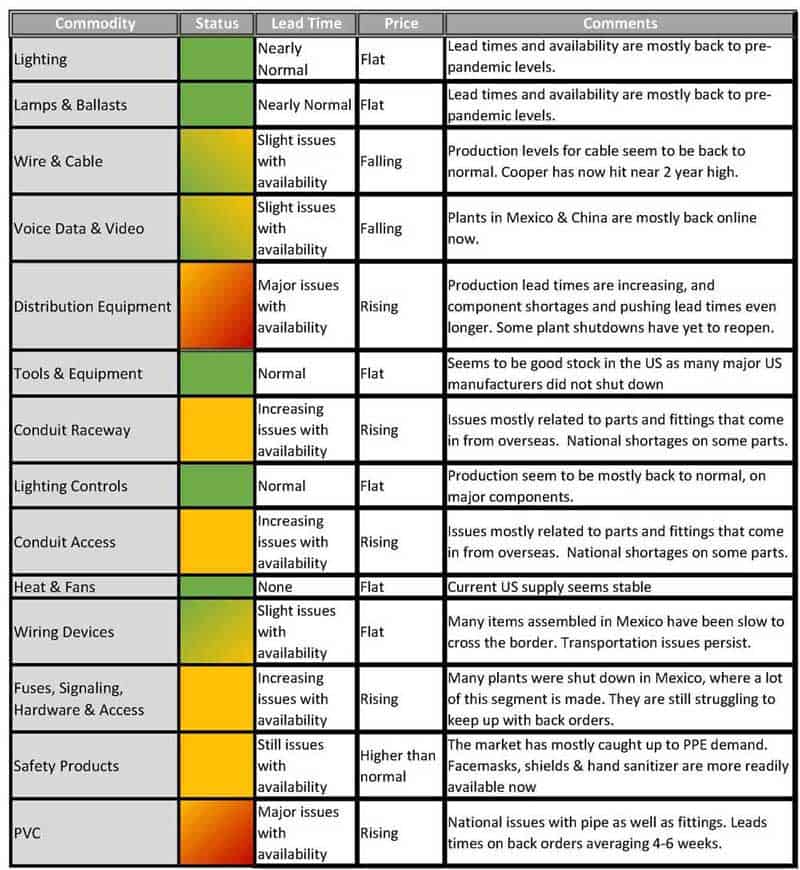
OCTOBER 2021 SUPPLY CHAIN UPDATE
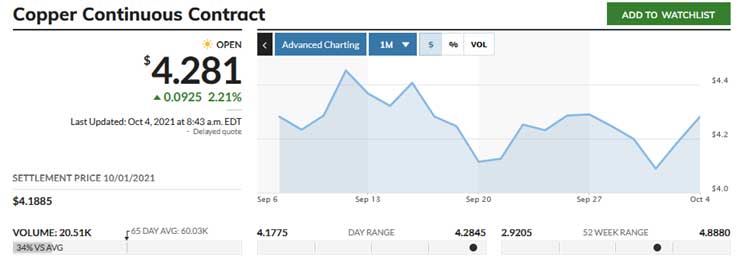
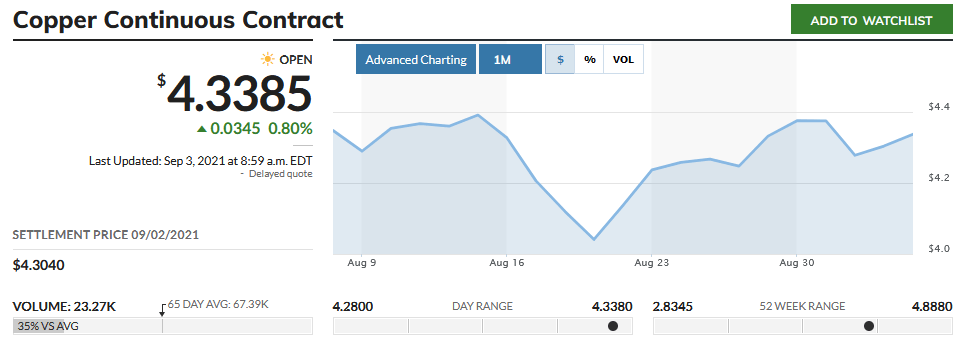
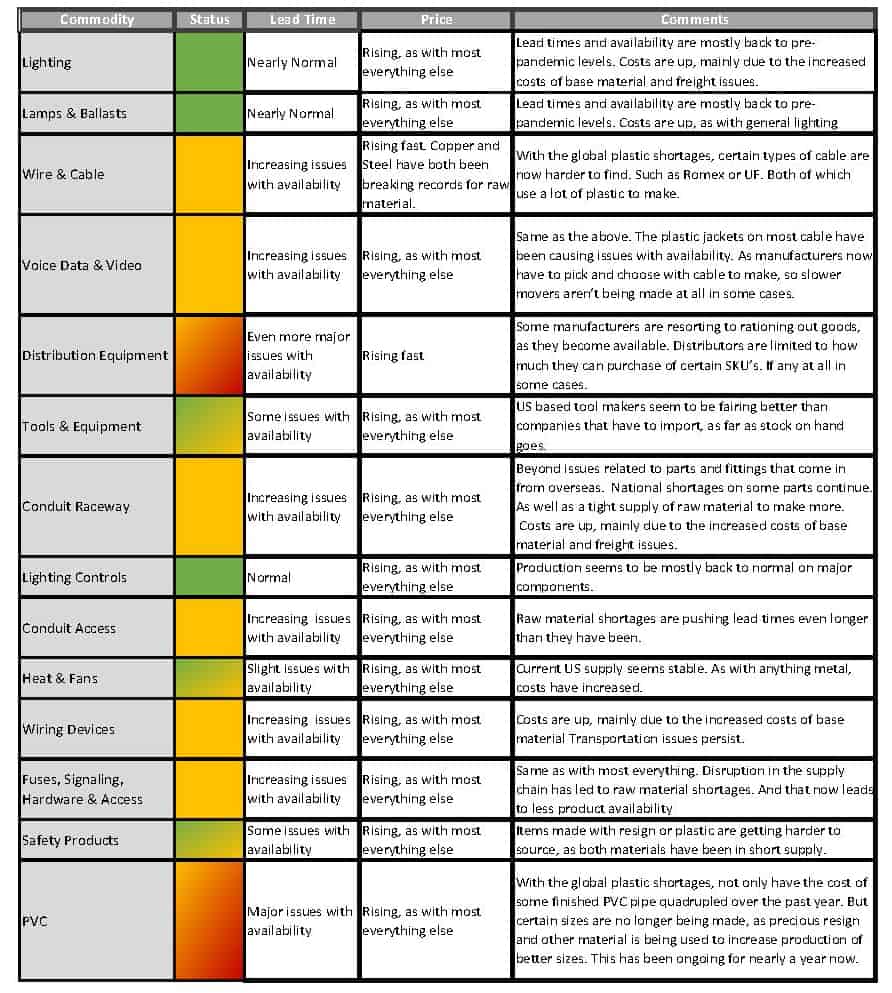
With many product families returning to nearly normal availability, there are still a few categories feeling the supply chain strain. The Chart below gives a high level overview of what we are seeing currently and is provided to help our customers plan ahead for their project needs.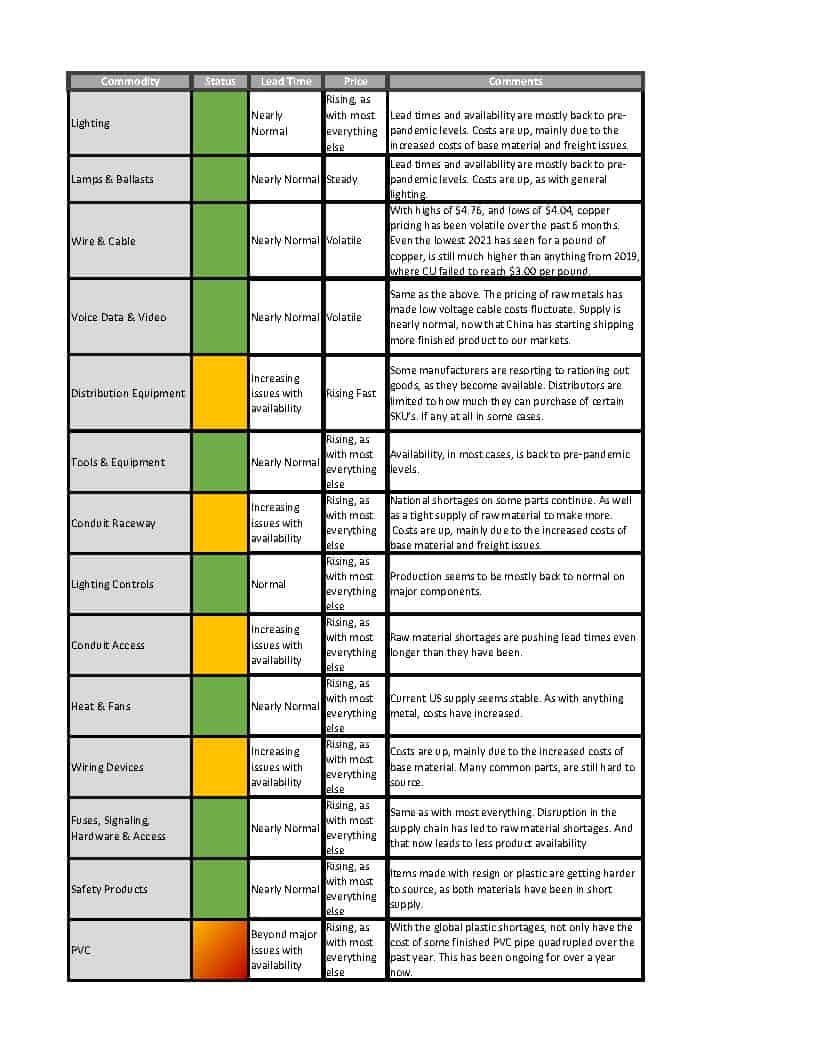 Copper took a dip for part of September, as news got out about China’s construction sector not doing very well. To start October, copper has been climbing once more. And as of now, it has currently regained any recent closes. While it is still trading nearly 60 cent per pound below this year’s high, it is worth noting, that that high was a record price paid for modern copper futures.
 Steel continues to be relentless. While the supply side has improved from earlier in the year, the cost of US made finished has stayed at historic levels. This is driving costs up on anything that touches US steel.
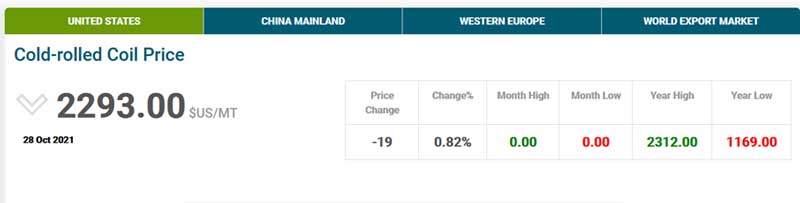
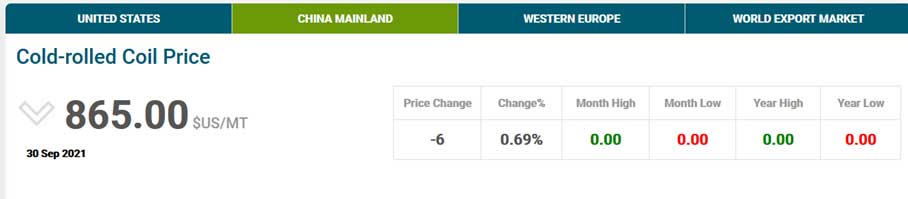
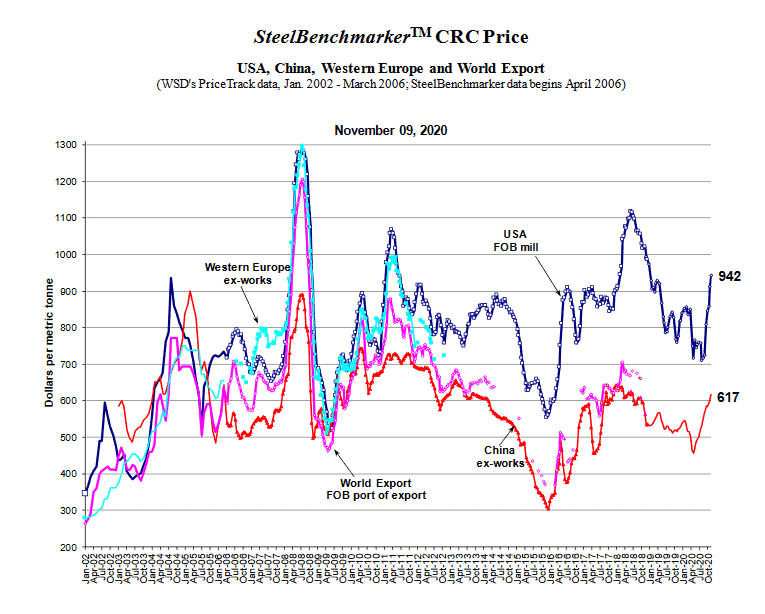
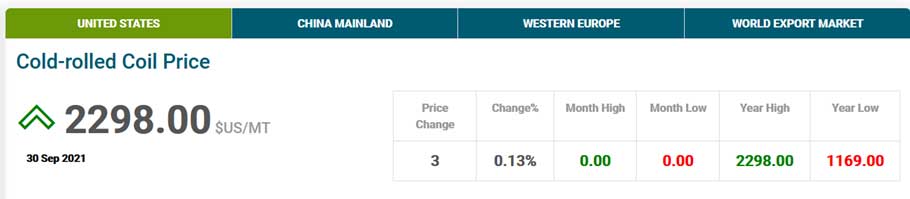 Import steel remains flat, as Chinese steel production seems to be very strong. With the below, you can see the difference in cost for a metric ton of CRC from China ($865) VS the US counterpart above ($2,298). While that difference is huge, for the essentially the same steel. Once you add the costs of tariffs, import duties and transportation, those numbers become much closer together.
 Beyond the cost of metals, there are still major delays on some goods. Be it staffing, sourcing or simply taking longer to move material from one place to another. Lead times can still be high, but should continue to improve throughout the years end.
——–
Beyond the cost of metals, there are still major delays on some goods. Be it staffing, sourcing or simply taking longer to move material from one place to another. Lead times can still be high, but should continue to improve throughout the years end.
——–
SEPTEMBER 2021 SUPPLY CHAIN UPDATE
Steel has continued to smash records, with August ending in yet another record high. As you can see from the chart below, Steel has nearly doubled since the start of the year. Not only does it cost more, it is still rather scarce. When buying some finished products for our industry, lengthy back orders from manufacturers have been quite common in 2021, and continue to be an issue as we enter Q4. From boxes and rings, to fittings and even conduit, the industry simply cannot keep up with demand right now.
Similarly, PVC pricing continues at an all-time high as well. With the recent hurricane off the Gulf leading to issues with poly production in Texas, and just general transportations disruptions, PVC tube is now a “Price in Effect” item. That is to say, no one is holding pricing on conduit from one day to the next. It is very fluid, and they reserve the right to raise the price without notice. This can be troublesome, especially if you have a project you need to plan.
The “red metal”, Copper dipped briefly, despite recent reports that CU production would not keep pace with demand (which should have kept costs high). It appears this looming 4th wave of COVID has a lot of people scared about the global economies tightening up again. Therefore, investors might not be pumping up construction metals like they were before this Delta variant started running rampant.
The dip can be seen on the graph below, but it was very short lived. That break in price, led to a flurry of action from market speculators. Couple that with an ever decreasing global stock of copper, less than what should be needed for expected demand, and copper has since rebounded to pretty much the same average we have seen the past few months.
Not only does it cost more, it is still rather scarce. When buying some finished products for our industry, lengthy back orders from manufacturers have been quite common in 2021, and continue to be an issue as we enter Q4. From boxes and rings, to fittings and even conduit, the industry simply cannot keep up with demand right now.
Similarly, PVC pricing continues at an all-time high as well. With the recent hurricane off the Gulf leading to issues with poly production in Texas, and just general transportations disruptions, PVC tube is now a “Price in Effect” item. That is to say, no one is holding pricing on conduit from one day to the next. It is very fluid, and they reserve the right to raise the price without notice. This can be troublesome, especially if you have a project you need to plan.
The “red metal”, Copper dipped briefly, despite recent reports that CU production would not keep pace with demand (which should have kept costs high). It appears this looming 4th wave of COVID has a lot of people scared about the global economies tightening up again. Therefore, investors might not be pumping up construction metals like they were before this Delta variant started running rampant.
The dip can be seen on the graph below, but it was very short lived. That break in price, led to a flurry of action from market speculators. Couple that with an ever decreasing global stock of copper, less than what should be needed for expected demand, and copper has since rebounded to pretty much the same average we have seen the past few months.
 Beyond the uptick in pricing, sourcing has been the biggest trouble area in our industry in 2021. Many manufacturers continue to allocate material, limit new purchase orders or otherwise keep us from buying all that we want. Rationing of material is only slowing the bleed for most of those that make goods for our industry. Back orders and lead times continue to be a source of frustration for all involved. With all of that, and the national trucking shortages, it has been a challenge to keep product moving.
We here at Paramont EO will continue to work our extensive network of partners to try and stay in front of all these issues and help keep your projects on track to the best of our ability, and encourage our customers to order material well ahead of time whenever possible.
Beyond the uptick in pricing, sourcing has been the biggest trouble area in our industry in 2021. Many manufacturers continue to allocate material, limit new purchase orders or otherwise keep us from buying all that we want. Rationing of material is only slowing the bleed for most of those that make goods for our industry. Back orders and lead times continue to be a source of frustration for all involved. With all of that, and the national trucking shortages, it has been a challenge to keep product moving.
We here at Paramont EO will continue to work our extensive network of partners to try and stay in front of all these issues and help keep your projects on track to the best of our ability, and encourage our customers to order material well ahead of time whenever possible.
AUGUST 2021 SUPPLY CHAIN UPDATE
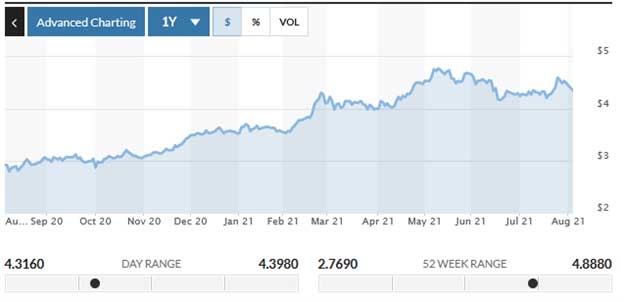
Steel pricing has been relentless, leading to even higher costs on finished goods. Nearly every month sets off a new round of “All Time Highest” prices on many common goods. As you can see below, Cold-Rolled Coil steel started 2021 at $1,169 per ton. As of our last update in July, it was $2,057. Now, to start August, we are looking at $2,193 for raw material alone. To better put things in perspective, a bundle of ½” EMT pipe now costs twice as much today, as it did last summer. That expense really adds up, in a pipe and wire market such as ours.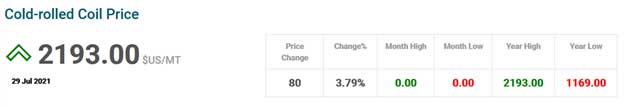 Copper itself is no slouch either. The chart below shows the 1 year progression of copper costs. Exactly a year ago, a pound of CU could be had for $2.76. Now? It has been trading in the mid $4.40’s lately.
Many reports are predicting a copper shortage in 2021. Beyond our industry, many Green Energy projects (Hydro, Solar & Wind) are chewing through a large amount of CU. As has the automotive industry, as they are producing more electric cars now than ever before.
Same as with steel, a spool of 12 STR building wire now costs twice as much as it did last summer. Same goes for most all building wire. And also as with steel, the supply chain is still struggling to keep up with demand.
Copper itself is no slouch either. The chart below shows the 1 year progression of copper costs. Exactly a year ago, a pound of CU could be had for $2.76. Now? It has been trading in the mid $4.40’s lately.
Many reports are predicting a copper shortage in 2021. Beyond our industry, many Green Energy projects (Hydro, Solar & Wind) are chewing through a large amount of CU. As has the automotive industry, as they are producing more electric cars now than ever before.
Same as with steel, a spool of 12 STR building wire now costs twice as much as it did last summer. Same goes for most all building wire. And also as with steel, the supply chain is still struggling to keep up with demand.
 These record high costs for finished goods are not just tied to cable and conduit either. A simple strut strap, as an example, now costs twice as much as it did last year. Same goes for things such as PVC fittings, nearly all of which has at least doubled in price. And other conduit, such as PVC pipe, has quadrupled in cost since last summer, mostly in part to resin shortages.
With such strong demand for building supplies, surging costs on raw material and a supply chain that has now been strangled for nearly a year, it doesn’t appear there will be any price relief in the near term. If anything, with so many manufacturers now allocating material to Distributors, and limiting just how much we can buy, expect to see more surge pricing on harder to get items in the near future.
These record high costs for finished goods are not just tied to cable and conduit either. A simple strut strap, as an example, now costs twice as much as it did last year. Same goes for things such as PVC fittings, nearly all of which has at least doubled in price. And other conduit, such as PVC pipe, has quadrupled in cost since last summer, mostly in part to resin shortages.
With such strong demand for building supplies, surging costs on raw material and a supply chain that has now been strangled for nearly a year, it doesn’t appear there will be any price relief in the near term. If anything, with so many manufacturers now allocating material to Distributors, and limiting just how much we can buy, expect to see more surge pricing on harder to get items in the near future.
JULY 2021 SUPPLY CHAIN UPDATE
Copper has continued its rebound in cost. As of this writing, it is currently trading at nearly $4.40 once more. But, the price of actual finished copper building wire never waned much. The material that goes into the jacket of the most common type of cable(s) in our market, THHN (Polyvinylchloride) & XHHW (Polyethylene) are both very much in short supply, and priced higher than they ever have been in the past. Lead times from the factories are continuing to rise, due to both demand and some shortages in raw material.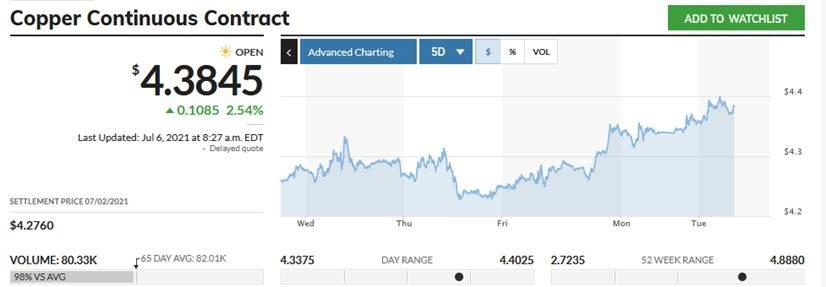 The same PVC shortages that are forcing cable pricing up, are doing the same to nearly every product that relies on plastic. Most major US manufacturers of PVC pipe are still not making certain sizes of conduit. As of this writing, Schedule 40 ½”, 1 ¼”, 2 ½” & 3 ½” still are not in production, as these companies are using the PVC and resin they have on hand to make more common sizes of pipe. Same goes for Schedule 80 PVC sizes, 3/4”, 1”, 1 ¼”, 1 ½”, 2 ½”, 3 ½” & 5”.
Steel continues to be nearly unstoppable, breaking records almost every couple of weeks.
The same PVC shortages that are forcing cable pricing up, are doing the same to nearly every product that relies on plastic. Most major US manufacturers of PVC pipe are still not making certain sizes of conduit. As of this writing, Schedule 40 ½”, 1 ¼”, 2 ½” & 3 ½” still are not in production, as these companies are using the PVC and resin they have on hand to make more common sizes of pipe. Same goes for Schedule 80 PVC sizes, 3/4”, 1”, 1 ¼”, 1 ½”, 2 ½”, 3 ½” & 5”.
Steel continues to be nearly unstoppable, breaking records almost every couple of weeks.
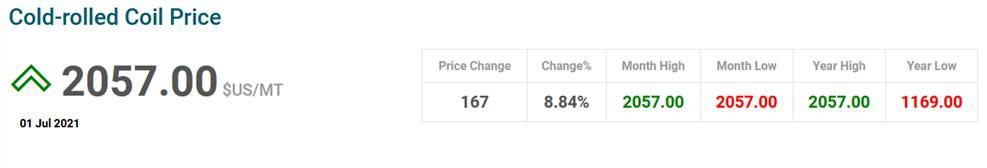 In the middle of March, a metric tonne of Cold Rolled Coiled Steel, which is most commonly used in our industry, was trading at $1,525. Currently, that is up over $525 more right now. Steel is actually in sort supply, and it appears to stay that way at least through summer.
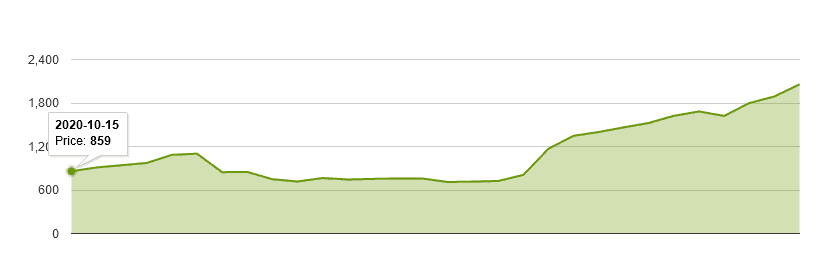
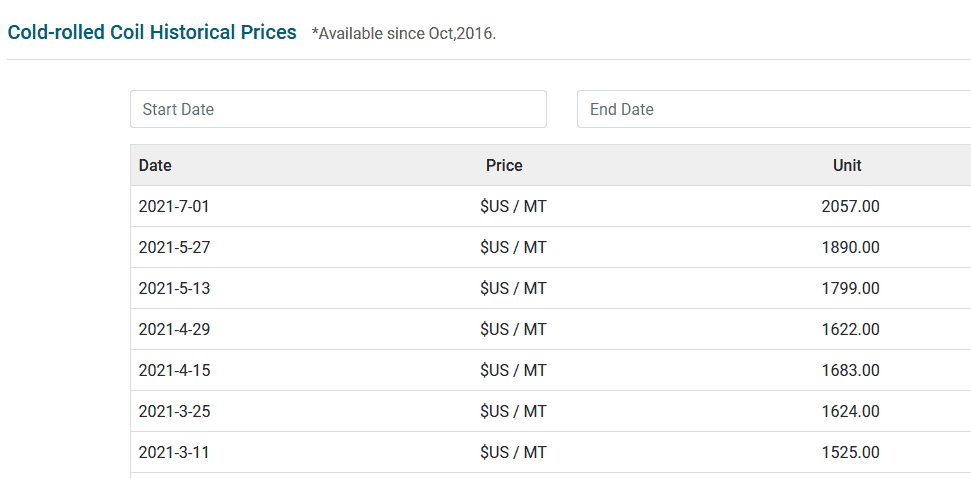 From October 2020 until now, Raw Steel has nearly tripled in value
JUNE 2021 SUPPLY CHAIN UPDATE
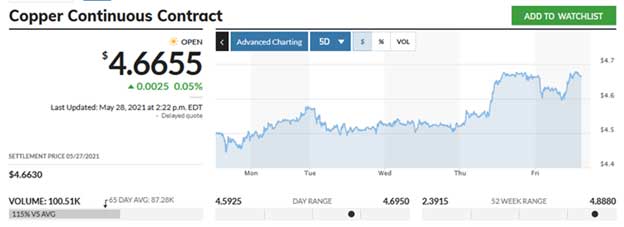
Steel pricing continues to be the talk of the town. With an extremely tight supply chain for raw material, and steel costs setting record highs here in the US almost weekly, most everything that touches steel has gone up in price. And more and more items are becoming harder to source because of all these factors. As you can see from the below, CRC had one lull to close April. And immediately shot back up in value shortly after. As of this writing, we are nearing $1,900 per metric ton. That is up $1,000 YTD. Well more than double what steel was trading for at the end of last year.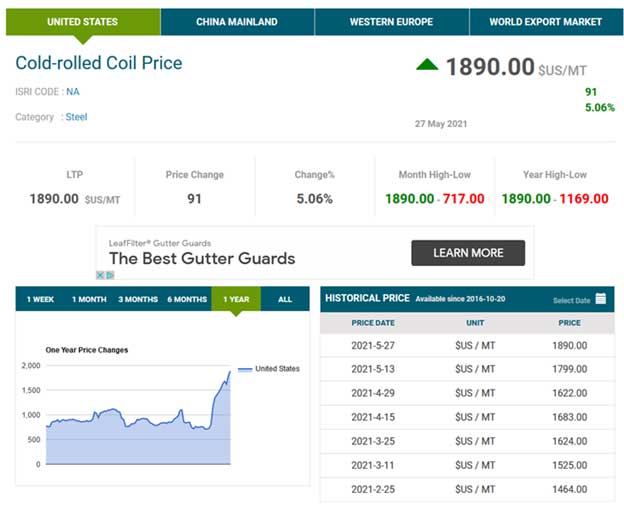 While Copper is not necessarily in short supply, it is still in demand. As with most everything metal, the price of CU is just as strong as ever. One year ago to the day, a pound of copper could be had for $2.40. Currently, it is nearing $4.70 once more. Now nearly double the price it was.
Outside forces are pushing the finished cost of copper cable up as well, beyond the surging cost of the red metal itself. The raw materials used to make the jacket that goes on finished cable, have often been hard to source and most certainly cost more right now as well.
While Copper is not necessarily in short supply, it is still in demand. As with most everything metal, the price of CU is just as strong as ever. One year ago to the day, a pound of copper could be had for $2.40. Currently, it is nearing $4.70 once more. Now nearly double the price it was.
Outside forces are pushing the finished cost of copper cable up as well, beyond the surging cost of the red metal itself. The raw materials used to make the jacket that goes on finished cable, have often been hard to source and most certainly cost more right now as well.
MAY 2021 SUPPLY CHAIN UPDATE
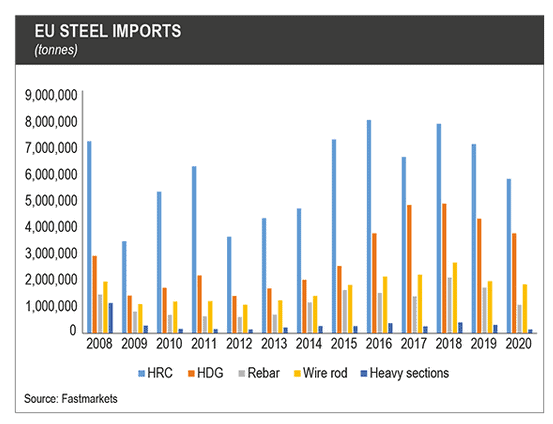
Steel continues to be pricey, as the 1 month chart shows below. In fact, the cost of a metric ton of Cold Rolled Steel has more than doubled in cost over the past year to date. Domestic steel mills that idled furnaces last year amid fears of a prolonged pandemic-induced economic downturn, have been slow in ramping up production. This is leading to them playing catch up, as prices are soaring due to demand as well as these shortages. The mills are constantly overbooked, and many are now past capacity.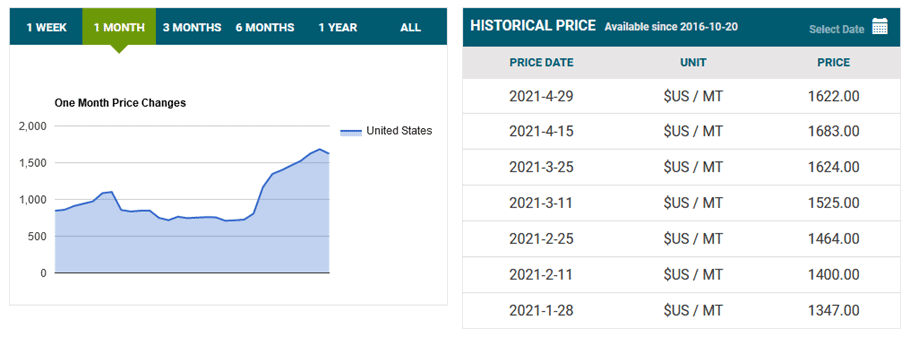 With the US Mills still not producing enough steel to meet demand. Many US manufacturers are once more turning to foreign steel, and just paying any import tariffs on that. This is now taxing an already strained foreign steel market as well. The EU is seeing their own steel shortages and price surges as well.
 A pound of copper? That has more than doubled in cost as well. Whereas steel has already broken its own cost record, Copper is just pennies away from doing the same.
APRIL 2021 SUPPLY CHAIN UPDATE
Our previous update saw CRC Steel hit an All-Time high of $1,464 per MT. As of last week, it was up to $1,624 per MT, with no signs of slowing down; continually breaking new records since the start of the year.OVERVIEW OF ELECTRICAL SUPPLY CHAIN KEY COMPONENTS

MARCH 2021 SUPPLY CHAIN UPDATE
The cost of base metals has been steadily climbing for months. This effects not only the costs for cable and conduit, but most everything we stock. Cold Rolled Coil, the steel our industry relies on, went from $850 in October 2021, to $1100 by New Years, and is currently at $1464 as of this update.MARCH 2021 SUPPLY CHAIN UPDATE
NEW YEAR, NEW PRICE INCREASES
January Supply Chain Updates
The cost of base metals have been steadily climbing for months. This effects not only the cost for cable and conduit, but most everything we stock. If the US dollar stays weak, it organically costs more to buy materials. If the supply chain stays strangled, it costs more due to demand. If the Pandemic drags on, things cost more due to COVID shutdowns. Combine all three dynamics and price increases become inevitable.January 2021 Supply Chain Updates
NEW KINKS IN THE SUPPLY CHAIN — NOVEMBER EDITION
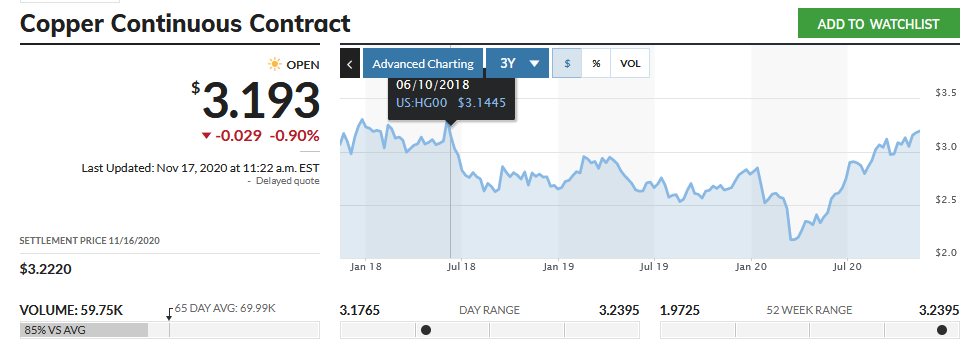
As the US continues to wait for a COVID Stimulus plan to be released, so does the EU. And with every new report of a highly functioning vaccine that gets reported, metals have been spiking. The market always responds well to positive outlooks. The vast majority of products in our industry touch both Copper and Steel. And as such, the value (and replacement costs) of those goods are at near recent record highs. CU hit its 2 year high yesterday, topping out at $3.2395. This is the highest its been since June 2018. As you can see below, Copper has soared back to life nearly every week since the initial COVID shutdowns. We have gone from a 1 year valley of $1.97 per pound. to a 1 year peak of $3.24 per pound.
Steel is no slouch either. CRC, Cold Rolled Coiled, is the base for our metallic raceway, and the metal that most effects our finished pipe price. The below chart shows that is was being purchased for $700 US per ton over the summer. It is currently at $942 and climbing. This has lead to record prices being asked for finished goods in our market. Nearly all “like” manufacturers are asking for the same higher costs these days. Forcing everyone to raise prices for product effected by these base metal increases.
In addition to price increases, we are still seeing some abnormalities in our supply chain as shown below:
November 2020 Supply Chain Updates
September 2020 Supply Chain Updates:
August 2020 Supply Chain Updates:
Coronavirus Impact on Supply Chain July Update: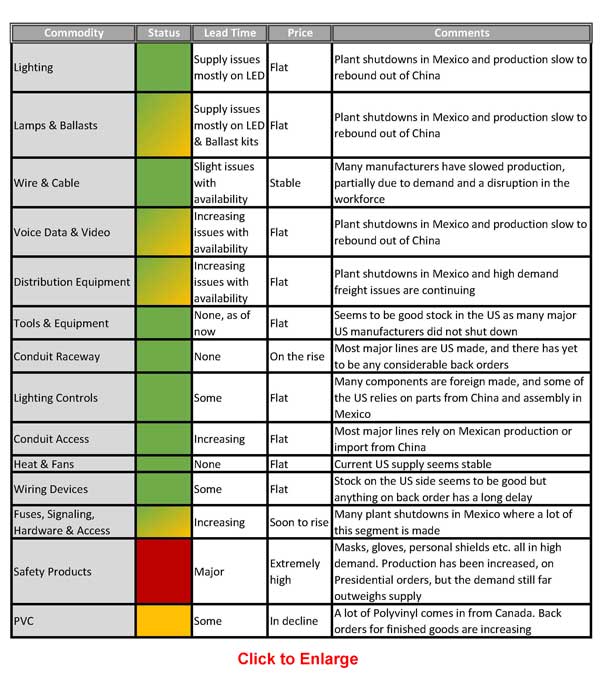
KEY TAKEAWAY?
As most supply availability stabilizes, many prices are rising.


